
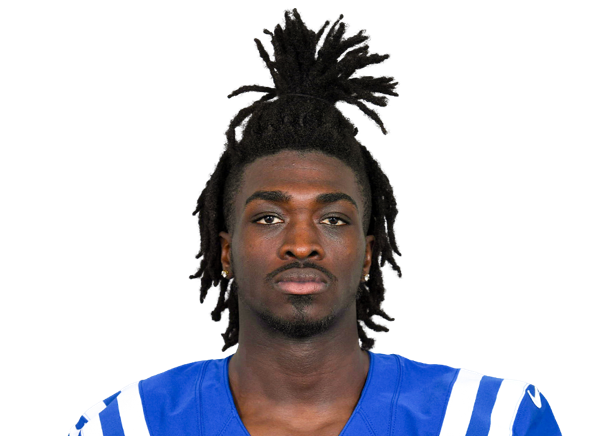
Ashton Dulin
Overview
2026 so far5 games
Week 10
Live linesIND MIA
Built on a IND team total of 21.5. Rank is among every WR we project this week.
Allowed to WRs per game across 8 games. Best games against them: Omar Cooper Jr. (W7, 22.5 PPR, 5/5 115 yds); Ja'Marr Chase (W5, 19.7 PPR, 6/10 77 yds); DeMario Douglas (W8, 16.6 PPR, 3/3 76 yds).
EPA ranks entering Week 10: #32 against the pass, #8 against the run (1 = best defense).
Big number: receiving fantasy points MIA allows a game to WRs in that zone. # = its rank of 32. Green tag = Ashton Dulin's share of his targets in that zone this season. Depth is air yards at the catch point; 8 games, through Week 9. Tap a zone for the detail.
Against MIA beforelast 3
| Game | Line | Pts |
|---|---|---|
| 2025 W1vs MIA · W 33-8 | 1-15 rush | 1.5 |
| 2024 W7vs MIA · W 16-10 | 1-12 rush | 1.2 |
| 2021 W4@ MIA · W 27-17 | 1-17 on 1 tgt | 2.2 |
1-3 rush, 1-55-1 rec on 2 tgt
Field
2026 · through W9Every target Ashton Dulin has, on the field: where it went, what came of it, and the situation, with filters for down, distance, field position, score and clock.
- 2026: 9 targets (4 caught): 1 at 20+ air yards, 6 under 10; 3 to the left, 0 over the middle, 6 to the right; −0.21 EPA a target.
- 2025: 10 targets (5 caught): 3 at 20+ air yards, 3 under 10; 6 to the left, 2 over the middle, 2 to the right; +0.57 EPA a target.
Spots are the play-by-play’s side and depth, not tracking. Open the full-screen Field Explorer.
Game log
2026 · through W9Every gametap a game for the detail
IND +3 (closing) · total 48.5 · indoors · 7 days rest


Projected 0.5 (WR142) · IND -4.5 (closing) · total 46.5 · 70°F, wind 7 mph · 7 days rest · Injury report: game status Q, practice FP


Projected 0.0 (WR176) · IND +6.5 (closing) · total 41.5 · indoors · 7 days rest · Injury report: practice FP
Projected 2.1 (WR102) · IND +10 (closing) · total 45.5 · 7 days rest · division game
Projected 1.0 (WR125) · IND +4.5 (closing) · total 51.5 · indoors · 7 days rest
D# = the opponent's rank against WRs entering that week (1 = stingiest, 32 = softest). Finish = his rank at WR that week.
Usage
What changedlast 3 full games vs. before
| W1, W4 | W7, W8, W9 | Change | |
|---|---|---|---|
| Snap share | 27.0% | 18.3% | −8.7 |
| Target share | 12.0% | 2.1% | −9.9 |
| Air-yard share | 14.9% | 6.9% | −8.0 |
| Targets a game | 3.5 | 0.7 | −2.8 |
Games he left injured are left out of both sides.
IND target treeshare of team targets, 2026
Season to date, games each player played.
Role details2026, through Week 9
Advanced
Percentile against the WRs on our charts (each stat's minimum is next to it), 2026 through Week 9. 50 is the middle of the pack. Tap a bubble for his rank.
Expected vs. actualPPR, from this season's play-by-play
1 TDs on 0.18 expected. Expected points price every target by depth and field position and every carry by field position. Do touchdowns regress? ›
Splits
As a receiver2026 charted plays, through Week 9
| Situation | Tgt | Rec-Yds-TD | Yds/tgt | EPA/tgt |
|---|---|---|---|---|
| All targets | 9 | 4-84-1 | 9.38.1 | -0.210.24 |
| Third down22% of targets | 2 | 1-0-0 | 0.07.3 | -2.290.16 |
| Score within 767% of targets | 6 | 3-29-0 | 4.88.1 | -0.830.24 |
| Trailing by 8+33% of targets | 3 | 1-55-1 | 18.37.9 | 1.020.22 |
| Two-minute drill22% of targets | 2 | 2-29-0 | 14.57.8 | 0.570.21 |
| Vs. the blitz33% of targets | 3 | 1-0-0 | 0.08.0 | -0.970.24 |
| No blitz67% of targets | 6 | 3-84-1 | 14.08.1 | 0.160.24 |
| Play action22% of targets | 2 | 1-0-0 | 0.010.2 | -1.120.38 |
| With motion67% of targets | 6 | 2-55-1 | 9.28.0 | -0.390.24 |
| Screens22% of targets | 2 | 1-55-1 | 27.55.1 | 1.98-0.16 |
Small grey number = every WR in that situation. Green or red = a clear gap either way. 5 of his 9 charted targets were catchable; 0 drops, 0 of 1 contested caught.
Against coverage2022-2025 (2026 is not charted per player)
| Coverage | Tgt | Yds/tgt | Caught | EPA/tgt |
|---|---|---|---|---|
| Man | 13 | 9.0 | 62% | −0.10 |
| Zone | 27 | 9.7 | 52% | +0.34 |
With and withoutfantasy points a game, IND, 2025–2026
"Without" = games he played and the teammate did not (a QB counts as playing with 10+ attempts). Games either of them left injured are left out. Small samples swing hard. Who benefits when a player gets hurt? ›
Team
INDIndianapolis Colts offense, 2026 through Week 9. Rank 1 = most. Scheme rates from FTN charting through Week 9.
Game by gamescore, implied total, pass rate (over expected), QB
| Week | Score | Implied | Pass rate | QB |
|---|---|---|---|---|
| W1vs BAL | 23-41 | 22.8 | 62%−6.4 | Jones31 att |
| W2vs KC | 30-30 | 20.3 | 49%−13.8 | Jones31 att |
| W3vs HOU | 19-17 | 20.0 | 56%−0.6 | Jones36 att |
| W4vs WAS | 30-13 | 25.5 | 56%−2.1 | Jones34 att |
| W5vs PIT | 22-34 | 19.3 | 65%+2.1 | Jones44 att |
| W6vs TEN | 20-26 | 25.0 | 61%−7.5 | Jones42 att |
| W7vs MIN | 10-16 | 17.5 | 44%−19.8 | Jones22 att |
| W8vs JAX | 7-42 | 17.8 | 59%−8.3 | Jones28 att |
| W9vs DAL | 23-27 | 23.5 | 61%−1.4 | Jones34 att |
Depth chartWR
Scheduleeach defense's current rank vs WRs




Green = soft, red = stingy (1 = stingiest, 32 = softest), ranked on fantasy points allowed to WRs so far. Gold underline = fantasy playoffs. Does strength of schedule matter? ›
Head coach: Shane Steichen. QB: Daniel Jones (most pass attempts, Week 9).
Charts
Ashton Dulin is highlighted on each chart. Swipe for more; tap a dot for the player. Every chart saves and shares as an image on the Charts page.
Career
Season by season
| Year | G | Rec-Yds-TD | Pts/g | xFP/g |
|---|---|---|---|---|
| 2026IND | 5 | 4-84-19 tgt, 6.1% share | 3.4WR112 | 3.0+3.9 |
| 2025IND | 12 | 5-106-010 tgt, 6.4% share, routes 18% | 1.5WR137 | 1.4+2.9 |
| 2024IND | 13 | 2-67-18 tgt, 5.2% share, routes 13% | 1.4WR136 | 1.6+5.0 |
| 2022IND | 10 | 15-207-122 tgt, 8.9% share, routes 26% | 3.5WR110 | 5.4+4.9 |
| 2021IND | 16 | 13-173-222 tgt, 6.0% share, routes 21% | 2.4WR129 | 2.7+7.4 |
| 2020IND | 8 | 3-53-06 tgt, 3.5% share, routes 8% | 1.0WR145 | 1.5−1.4 |
Under points a game: his rank at WR in points a game (8+ games; 2026: 2+ games). xFP = expected PPR a game from his usage; under it, the season's points over expected. Routes = share of team dropbacks he ran a route (through 2025).
Red zone and touchdowns
| 2025 | 2 RZ car (2%), 0 inside 5, 0 rush TD vs 0.1 exp · 1 RZ tgt (1%), 0 end-zone, 0 rec TD vs 0.2 exp |
| 2024 | 1 RZ car (1%), 0 inside 5, 0 rush TD vs 0.0 exp · 1 RZ tgt (2%), 1 end-zone, 0 rec TD vs 0.5 exp |
| 2022 | 4 RZ tgt (6%), 2 end-zone, 1 rec TD vs 1.0 exp |
| 2021 | 2 RZ tgt (3%), 2 end-zone, 1 rec TD vs 1.0 exp |
Floor and ceilingPPR
0 of his last 25 games reached 20 PPR; 24 finished under 10. Is there a floor-vs-ceiling trade-off? ›
Every game since 2020
2025 game log 12 games · IND · 1.7 PPR a game
| Game | Line | Snaps | Pts |
|---|---|---|---|
| W1vs MIA · D4 | 1-15 rush | 14% | 1.5 |
| W2vs DEN · D9 | no stats | 14% | 0.0 |
| W3@ TEN · D2 | no stats | 16% | 0.0 |
| W4@ LA · D19 | 1-11 on 1 tgt · 1-7 rush | 20% | 2.3 |
| W5vs LV · D30 | 2-55 on 5 tgt | 71% | 6.5 |
| W6vs ARI · D14 | no stats | 2% | 0.0 |
| W8vs TEN · D21 | 1--8 on 1 tgt | 25% | -0.3 |
| W9@ PIT · D30 | no stats | 8% | 0.0 |
| W10vs ATL · D7 | 1-22 rush | 19% | 2.2 |
| W12@ KC · D6 | 1-48 on 1 tgt | 18% | 5.3 |
| W17vs JAX · D21 | no stats | 12% | 0.0 |
| W18@ HOU · D2 | 0-0 on 2 tgt | 37% | 0.0 |
2024 game log 13 games · IND · 1.5 PPR a game
| Game | Line | Snaps | Pts |
|---|---|---|---|
| W1vs HOU · D11 | 1-54-1 on 1 tgt | 24% | 11.9 |
| W2@ GB · D13 | 1-13 on 2 tgt | 43% | 1.8 |
| W3vs CHI · D16 | 0-0 on 1 tgt | 25% | 0.0 |
| W5@ JAX · D28 | 1-9 rush | 21% | 0.9 |
| W6@ TEN · D1 | 0-0 on 1 tgt | 16% | 0.0 |
| W7vs MIA · D2 | 1-12 rush | 24% | 1.2 |
| W8@ HOU · D21 | no stats | 16% | 0.0 |
| W9@ MIN · D32 | 0-0 on 2 tgt · 2-17 rush | 19% | 1.7 |
| W10vs BUF · D6 | 1-7 rush | 19% | 0.7 |
| W11@ NYJ · D1 | no stats | 23% | 0.0 |
| W12vs DET · D28 | 0-0 on 1 tgt | 18% | 0.0 |
| W16vs TEN · D5 | no stats | 15% | 0.0 |
| W18vs JAX · D25 | no stats | 10% | 0.0 |
2022 game log 10 games · IND · 4.3 PPR a game
| Game | Line | Snaps | Pts |
|---|---|---|---|
| W1@ HOU | 3-46 on 6 tgt | 35% | 6.1 |
| W2@ JAX | 5-79 on 7 tgt · 1-3 rush | 64% | 10.7 |
| W3vs KC | 1-7 on 1 tgt | 25% | 1.2 |
| W4vs TEN · D28 | 2-18 on 3 tgt | 29% | 2.8 |
| W5@ DEN · D2 | 1-18 on 1 tgt | 15% | 2.3 |
| W11vs PHI · D10 | no stats | 20% | 0.0 |
| W12vs PIT · D32 | no stats | 34% | 0.0 |
| W13@ DAL · D13 | 1-14-1 on 2 tgt | 28% | 7.9 |
| W15@ MIN · D32 | 2-25 on 2 tgt · 1-5 rush | 23% | 4.0 |
| W16vs LAC · D8 | no stats | 17% | 0.0 |
2021 game log 16 games · IND · 2.8 PPR a game
| Game | Line | Snaps | Pts |
|---|---|---|---|
| W1vs SEA | no stats | 8% | 0.0 |
| W2vs LA | 1-10 on 2 tgt | 39% | 1.5 |
| W3@ TEN | 1--7 rush | 11% | -0.7 |
| W4@ MIA | 1-17 on 1 tgt | 17% | 2.2 |
| W5@ BAL | 2-13 on 2 tgt | 33% | 2.3 |
| W6vs HOU | 1-7 on 1 tgt | 27% | 1.2 |
| W7@ SF | 2-0 on 4 tgt | 63% | 1.0 |
| W8vs TEN | 0-0 on 4 tgt | 36% | 0.0 |
| W9vs NYJ | 2-23 on 2 tgt | 37% | 3.3 |
| W10vs JAX | 1-16 on 1 tgt | 11% | 2.1 |
| W11@ BUF | no stats | 29% | 0.0 |
| W12vs TB | 1-62-1 on 1 tgt | 6% | 12.7 |
| W13@ HOU | 1-2-1 on 1 tgt | 31% | 6.7 |
| W15vs NE | 2-39 rush | 54% | 3.9 |
| W16@ ARI | 1-23 on 2 tgt | 40% | 2.8 |
| W17vs LV | 0-0 on 1 tgt | 47% | 0.0 |
2020 game log 10 games · IND · 0.9 PPR a game
| Game | Line | Snaps | Pts |
|---|---|---|---|
| W1@ JAX | no stats | 0% | 0.0 |
| W2vs MIN | 1-6 on 1 tgt | 8% | 1.1 |
| W3vs NYJ | 0-0 on 1 tgt | 20% | 0.0 |
| W5@ CLE | 1-34 on 1 tgt · 1-3 rush | 13% | 4.2 |
| W6vs CIN | no stats | 10% | 0.0 |
| W8@ DET | 1-13 on 1 tgt | 12% | 1.8 |
| W12vs TEN | no stats | 0% | 0.0 |
| W13@ HOU | 0-0 on 1 tgt | 12% | 0.0 |
| W16@ PIT | 1-8 rush | 12% | 0.8 |
| W17vs JAX | 0-0 on 1 tgt | 24% | 0.0 |
Health
No injury designation. Not on the Sleeper injury list and not on the Week 10 practice report so far.
2026 injury reportofficial, week by week
✓ = not listed. Letters = game status (Q, D, O) or worst practice that week (LP limited, DNP did not practice). Tap a week for the detail.
Historyofficial injury reports since 2020
| Year | Weeks listed | Ruled out | Listed for |
|---|---|---|---|
| 2025 | 3 | 1 | Chest (2), Hamstring |
| 2024 | 4 | 2 | Ankle (3), Knee |
| 2022 | 2 | 1 | Concussion (2) |
| 2020 | 1 | 1 | Knee |
5 games missed 2023–25 (1.00 a season), Knee, Concussion, Ankle, Chest.
10 report weeks over 4 seasons; recurring: Knee, Concussion, Ankle, Chest, Hamstring. Risk label: moderate.
Teammates on the report
Our current notes first, then Sleeper designations. What happens when a starter is ruled out? ›
Value
170.0 overall, WR109. ESPN 170.0 · Underdog 216.0