
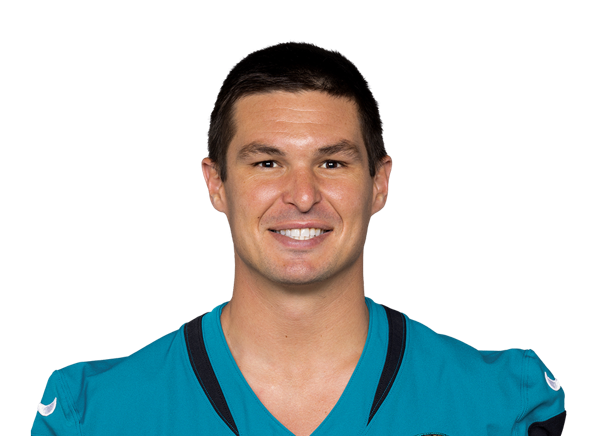
Nick Mullens
Overview
2026 so far1 game
Week 10
Live linesJAX TEN
Built on a JAX team total of 28.5. Rank is among every QB we project this week.
Allowed to QBs per game across 8 games. Best games against them: Joe Burrow (W8, 39.48 PPR, 462 py, 5 TD); C.J. Stroud (W5, 20.94 PPR, 261 py, 1 TD); Lamar Jackson (W4, 18.88 PPR, 222 py, 2 TD).
EPA ranks entering Week 10: #29 against the pass, #16 against the run (1 = best defense).
Big number: QB passing points TEN allows a game to QBs in that zone. # = its rank of 32. Depth is air yards at the catch point; 8 games, through Week 9. Tap a zone for the detail.
Against TEN beforelast 2
| Game | Line | Pts |
|---|---|---|
| 2025 W18vs TEN · W 41-7 | 2/2 16 yds 0 TD · 3--2 rush | 0.4 |
| 2025 W13@ TEN · W 25-3 | 3--3 rush | -0.3 |
no stats recorded
Field
2025Every pass Nick Mullens has, on the field: where it went, what came of it, and the situation, with filters for down, distance, field position, score and clock.
- 2025: 3 passes, 3 complete; 0 of 0 at 20+ air yards; +0.97 EPA a pass.
Spots are the play-by-play’s side and depth, not tracking. Open the full-screen Field Explorer.
Game log
2026 · through W9Every gametap a game for the detail
JAX -8.5 (closing) · total 40.5 · 89°F, wind 3 mph · 7 days rest







D# = the opponent's rank against QBs entering that week (1 = stingiest, 32 = softest). Finish = his rank at QB that week.
Usage
JAX target treeshare of team targets, 2026
Season to date, games each player played.
Team
JAXJacksonville Jaguars offense, 2026 through Week 9. Rank 1 = most. Scheme rates from FTN charting through Week 9.
Game by gamescore, implied total, pass rate (over expected), QB
| Week | Score | Implied | Pass rate | QB |
|---|---|---|---|---|
| W1vs CLE | 34-10 | 24.5 | 45%−4.7 | Lawrence23 att |
| W2vs DEN | 13-20 | 21.5 | 56%−7.1 | Lawrence29 att |
| W3vs NE | 35-6 | 24.8 | 49%−5.2 | Lawrence29 att |
| W4vs CIN | 22-17 | 24.5 | 53%−6.0 | Lawrence23 att |
| W5vs PHI | 19-17 | 24.5 | 60%−8.9 | Lawrence39 att |
| W6vs HOU | 31-34 | 22.5 | 61%−1.0 | Lawrence41 att |
| W8vs IND | 42-7 | 27.8 | 38%−19.1 | Lawrence14 att |
| W9vs BAL | 33-10 | 24.5 | 47%−7.9 | Lawrence26 att |
Depth chartQB
Scheduleeach defense's current rank vs QBs





Green = soft, red = stingy (1 = stingiest, 32 = softest), ranked on fantasy points allowed to QBs so far. Gold underline = fantasy playoffs. Does strength of schedule matter? ›
Career
Season by season
| Year | G | Passing / rushing | Pts/g | xFP/g |
|---|---|---|---|---|
| 2026JAX | 1 | 0 yds, 0 TD, 0 INT-3 rush yds, 0 TD | -0.3 | — |
| 2025JAX | 4 | 19 yds, 0 TD, 0 INT-8 rush yds, 0 TD | 0.0 | 2.6−10.5 |
| 2024MIN | 4 | 38 yds, 0 TD, 0 INT-2 rush yds, 0 TD | 0.3 | 0.8−1.9 |
| 2023MIN | 5 | 1,306 yds, 7 TD, 8 INT25 rush yds, 0 TD | 13.3 | 14.1−3.8 |
| 2022MIN | 4 | 224 yds, 1 TD, 1 INT8 rush yds, 0 TD | 2.9 | 3.4−1.9 |
| 2021CLE | 1 | 147 yds, 1 TD, 0 INT0 rush yds, 0 TD | 9.9 | 13.4−3.5 |
| 2020SF | 10 | 2,437 yds, 12 TD, 12 INT8 rush yds, 0 TD | 11.6QB31 | 15.9−42.8 |
Under points a game: his rank at QB in points a game (8+ games; 2026: 2+ games). xFP = expected PPR a game from his usage; under it, the season's points over expected.
Red zone and touchdowns
| 2025 | 1 RZ att, 0 pass TD vs 0.1 exp |
| 2023 | 18 RZ att, 3 pass TD vs 4.0 exp · 2 RZ car (4%), 0 inside 5, 0 rush TD vs 0.2 exp |
| 2022 | 3 RZ att, 1 pass TD vs 0.5 exp · 3 RZ car (4%), 1 inside 5, 0 rush TD vs 0.6 exp |
| 2021 | 3 RZ att, 1 pass TD vs 0.8 exp |
Floor and ceilingPPR
1 of his last 13 games reached 20 PPR; 10 finished under 10. Is there a floor-vs-ceiling trade-off? ›
Every game since 2020
2025 game log 4 games · JAX · 0.0 PPR a game
| Game | Line | Snaps | Pts |
|---|---|---|---|
| W13@ TEN · D20 | 3--3 rush | 5% | -0.3 |
| W14vs IND · D12 | 1/1 3 yds 0 TD · 3--1 rush | 9% | 0.0 |
| W15vs NYJ · D19 | 3--2 rush | 13% | -0.2 |
| W18vs TEN · D26 | 2/2 16 yds 0 TD · 3--2 rush | 18% | 0.4 |
2024 game log 4 games · MIN · 0.4 PPR a game
| Game | Line | Snaps | Pts |
|---|---|---|---|
| W3vs HOU · D20 | 1-0 rush | 3% | 0.0 |
| W5vs NYJ · D2 | 1/1 24 yds 0 TD | 1% | 1.0 |
| W12@ CHI · D1 | 1/1 14 yds 0 TD | 3% | 0.6 |
| W14vs ATL · D25 | 2--2 rush | 3% | -0.2 |
2023 game log 5 games · MIN · 13.3 PPR a game
| Game | Line | Snaps | Pts |
|---|---|---|---|
| W14@ LV · D13 | 9/13 83 yds 0 TD | 26% | 3.3 |
| W15@ CIN · D23 | 26/33 303 yds 2 TD 2 INT · 6-10 rush | 100% | 17.1 |
| W16vs DET · D27 | 22/36 411 yds 2 TD 4 INT · 1-1 rush | 100% | 16.5 |
| W17vs GB · D19 | 13/22 113 yds 1 TD · 1-6 rush | 55% | 9.1 |
| W18@ DET · D27 | 30/44 396 yds 2 TD 2 INT · 2-8 rush | 100% | 20.6 |
2022 game log 4 games · MIN · 3.0 PPR a game
| Game | Line | Snaps | Pts |
|---|---|---|---|
| W9@ WAS · D22 | 1/1 -3 yds 0 TD | 2% | -0.1 |
| W11vs DAL · D7 | 5/7 54 yds 0 TD | 21% | 2.2 |
| W17@ GB · D10 | 4/4 57 yds 1 TD | 14% | 6.3 |
| W18@ CHI · D26 | 11/13 116 yds 0 TD 1 INT · 4-8 rush | 46% | 3.4 |
2021 game log 1 games · CLE · 9.9 PPR a game
| Game | Line | Snaps | Pts |
|---|---|---|---|
| W15vs LV | 20/30 147 yds 1 TD | 100% | 9.9 |
2020 game log 10 games · SF · 11.6 PPR a game
| Game | Line | Snaps | Pts |
|---|---|---|---|
| W2@ NYJ | 8/11 71 yds 0 TD · 2--2 rush | 48% | 0.6 |
| W3@ NYG | 25/36 343 yds 1 TD · 4-0 rush | 97% | 17.7 |
| W4vs PHI | 18/26 200 yds 1 TD | 68% | 6.0 |
| W8@ SEA | 18/25 238 yds 2 TD | 41% | 17.5 |
| W9vs GB | 22/35 291 yds 1 TD · 1-0 rush | 100% | 11.6 |
| W10@ NO | 24/38 247 yds 1 TD · 1-3 rush | 99% | 10.2 |
| W12@ LA | 24/35 252 yds 0 TD | 100% | 8.1 |
| W13vs BUF | 26/39 316 yds 3 TD | 100% | 20.6 |
| W14vs WAS | 25/45 260 yds 1 TD | 100% | 12.4 |
| W15@ DAL | 21/36 219 yds 2 TD · 1-7 rush | 92% | 11.5 |
Health
No injury designation. Not on the Sleeper injury list and not on the Week 10 practice report so far.
2026 injury reportofficial, week by week
✓ = not listed. Letters = game status (Q, D, O) or worst practice that week (LP limited, DNP did not practice). Tap a week for the detail.
Historyofficial injury reports since 2020
| Year | Weeks listed | Ruled out | Listed for |
|---|---|---|---|
| 2023 | 3 | 0 | Back (3) |
| 2020 | 1 | 1 | right Elbow |
4 report weeks over 2 seasons; recurring: right Elbow, Back. Risk label: low.
Value
2024 Trey Lance (35% match). He went from 3.2 to 3.4 PPR a game the next year (QB5+→QB5+). His dynasty value moved +0.1% over the next 12 months.
170.0 overall, QB53. ESPN 170.0