
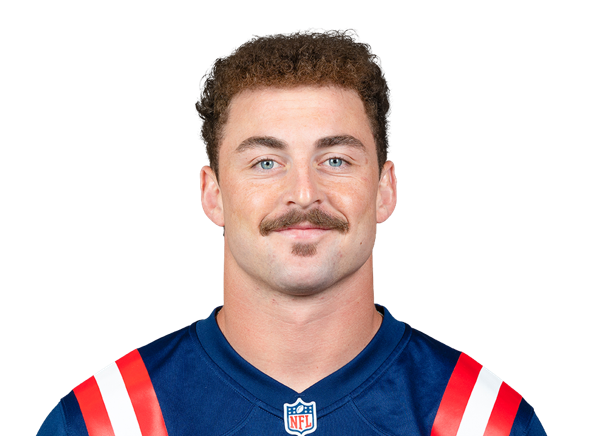
Lan Larison
Overview
2026 so far3 games
Week 10
Live linesNE DET
Built on a NE team total of 24.5. Rank is among every RB we project this week.
Allowed to RBs per game across 8 games. Best games against them: Chuba Hubbard (W4, 25.9 PPR, 20 car 122 ry, 1/2 7 rec); James Cook (W2, 20.9 PPR, 21 car 135 ry, 1/3 4 rec); Josh Jacobs (W7, 20.1 PPR, 11 car 36 ry, 5/7 55 rec).
EPA ranks entering Week 10: #24 against the pass, #12 against the run (1 = best defense).
Runs by directionRB rushing points allowed a game
Big number: receiving fantasy points DET allows a game to RBs in that zone. # = its rank of 32. Green tag = Lan Larison's share of his targets in that zone this season. Depth is air yards at the catch point; 8 games, through Week 9. Tap a zone for the detail.
1-4 rush, 0-0 rec on 1 tgt
Field
2026 · through W9Every carry Lan Larison has, on the field: where it went, what came of it, and the situation, with filters for down, distance, field position, score and clock.
- 2026: 3 carries at 3.3 a carry, most through the middle (2); +0.11 EPA a carry.
Spots are the play-by-play’s side and depth, not tracking. Open the full-screen Field Explorer.
Game log
2026 · through W9Every gametap a game for the detail
NE +3 (closing) · total 44.5 · 74°F, wind 6 mph · 7 days rest · prime time





Projected 0.0 (RB120) · NE -7 (closing) · total 41.5 · 10 days rest · division game
Projected 0.0 (RB124) · NE -3 (closing) · total 44.5 · 7 days rest
D# = the opponent's rank against RBs entering that week (1 = stingiest, 32 = softest). Finish = his rank at RB that week.
Usage
NE backfieldshare of team carries, 2026
Season to date, games each player played.
Splits
As a receiver2026 charted plays, through Week 9
| Situation | Tgt | Rec-Yds-TD | Yds/tgt | EPA/tgt |
|---|---|---|---|---|
| All targets | 3 | 2-9-0 | 3.05.6 | -0.230.02 |
| Score within 767% of targets | 2 | 2-9-0 | 4.55.6 | 0.04-0.02 |
| Trailing by 8+33% of targets | 1 | 0-0-0 | 0.05.8 | -0.780.10 |
| Vs. the blitz67% of targets | 2 | 2-9-0 | 4.55.9 | 0.040.02 |
| No blitz33% of targets | 1 | 0-0-0 | 0.05.6 | -0.780.02 |
| Play action33% of targets | 1 | 1-11-0 | 11.06.0 | 0.700.11 |
Small grey number = every RB in that situation. Green or red = a clear gap either way. 2 of his 3 charted targets were catchable; 0 drops, 0 of 1 contested caught.
As a runner2026 charted carries, through Week 9
| Situation | Car | Yds-TD | YPC | Success |
|---|---|---|---|---|
| All carries | 3 | 10-0 | 3.34.2 | 67%39% |
| Third down33% of carries | 1 | 4-0 | 4.03.9 | 100%52% |
| Score within 767% of carries | 2 | 6-0 | 3.04.1 | 50%39% |
| Trailing by 8+33% of carries | 1 | 4-0 | 4.04.2 | 100%40% |
| Light box (6 or fewer)33% of carries | 1 | 4-0 | 4.04.4 | 100%39% |
Box counts from FTN charting. Small grey number = every RB in that situation.
Team
NENew England Patriots offense, 2026 through Week 9. Rank 1 = most. Scheme rates from FTN charting through Week 9.
Game by gamescore, implied total, pass rate (over expected), QB
| Week | Score | Implied | Pass rate | QB |
|---|---|---|---|---|
| W1vs SEA | 10-13 | 20.8 | 54%−11.5 | Maye33 att |
| W2vs PIT | 20-3 | 23.0 | 49%+0.7 | Maye22 att |
| W3vs JAX | 6-35 | 21.8 | 57%−12.6 | Maye25 att |
| W4vs BUF | 29-26 | 21.3 | 54%−1.7 | Maye37 att |
| W5vs LV | 45-17 | 24.5 | 56%−1.5 | Maye34 att |
| W6vs NYJ | 26-19 | 25.5 | 48%−8.6 | Maye32 att |
| W7vs CHI | 24-30 | 23.8 | 65%−2.7 | Maye31 att |
| W8vs MIA | 24-19 | 24.3 | 41%−16.4 | Maye20 att |
| W9vs GB | 27-45 | 23.8 | 74%+0.9 | Maye38 att |
Depth chartRB
Scheduleeach defense's current rank vs RBs




Green = soft, red = stingy (1 = stingiest, 32 = softest), ranked on fantasy points allowed to RBs so far. Gold underline = fantasy playoffs. Does strength of schedule matter? ›
Head coach: Mike Vrabel. QB: Drake Maye (most pass attempts, Week 9).
Career
Season by season
| Year | G | Rushing / receiving | Pts/g | xFP/g |
|---|---|---|---|---|
| 2026NE | 3 | 3-10-0 rush2-9-0 rec on 3 tgt | 1.0RB104 | — |
Under points a game: his rank at RB in points a game (8+ games; 2026: 2+ games). xFP = expected PPR a game from his usage; under it, the season's points over expected. Routes = share of team dropbacks he ran a route (through 2025).
Health
No injury designation. Not on the Sleeper injury list and not on the Week 10 practice report so far.
2026 injury reportofficial, week by week
✓ = not listed. Letters = game status (Q, D, O) or worst practice that week (LP limited, DNP did not practice). Tap a week for the detail.
Teammates on the report
Our current notes first, then Sleeper designations. What happens when a starter is ruled out? ›
Value
170.0 overall, RB76. ESPN 170.0