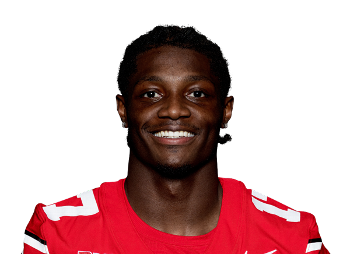

Carnell Tate
Overview
Board Oct 12Week 5 rest-of-season review, Oct 12, 2026. The three reads are where our backtested model, the betting market and his 2026 production each place him at WR; our board rank is the call.
Where his stats say he could finish from here: WR23 to WR43. Our rank stays the call.
2026 so far5 games
- 46% of TEN's air yards (3rd of 103 WRs)
- 25.9% target share (18th of 103 WRs)
- 7.4 targets a game (22nd of 103 WRs)
- 6% of TEN's red-zone targets (84th of 103 WRs)
- 30% of targets become first downs (82nd of 103 WRs)
Ranked among 103 qualified WRs this season.
80% range 4.5–14.0 half-PPR points a game. Biggest inputs: catches per game +0.5, WOPR +0.4, air-yard share +0.4, preseason ADP +0.4. The model informs the rank; it does not set it.
Week 6
Lines Oct 14TEN IND
INDUpdated Oct 14, 2026, built on a TEN team total of 18.75. Rank is among every WR we project this week.
Allowed to WRs per game across 5 games. Best games against them: Zay Flowers (W1, 26 PPR, 5/6 150 yds); Germie Bernard (W5, 14.4 PPR, 6/9 80 yds); Xavier Worthy (W2, 13.5 PPR, 5/7 25 yds).
EPA ranks entering Week 6: #21 against the pass, #32 against the run (1 = best defense).
Big number: receiving fantasy points IND allows a game to WRs in that zone. # = its rank of 32. Green tag = Carnell Tate's share of his targets in that zone this season. Depth is air yards at the catch point; 5 games, through Week 5. Tap a zone for the detail.
1-6 rec on 5 tgt
Game log
2026 · through W5Every gametap a game for the detail
TEN -1.5 (closing) · total 39.5 · 90°F, wind 2 mph · 7 days rest
Projected 7.7 (WR51) · TEN +7 (closing) · total 39.5 · 92°F, wind 5 mph · 7 days rest
Projected 8.8 (WR36) · TEN +2.5 (closing) · total 37.5 · 62°F, wind 10 mph · 7 days rest
Projected 10.2 (WR27) · TEN +11.5 (closing) · total 42.5 · 62°F, wind 6 mph · 7 days rest
Projected 12.1 (WR15) · TEN +6.5 (closing) · total 37.5 · 7 days rest · division game · Injury report: game status Q, practice LP
D# = the opponent's rank against WRs entering that week (1 = stingiest, 32 = softest). Finish = his rank at WR that week.
Usage
What changedlast 3 full games vs. before
| W1, W2 | W3, W4, W5 | Change | |
|---|---|---|---|
| Snap share | 81.5% | 82.7% | +1.2 |
| Target share | 25.4% | 27.6% | +2.2 |
| Air-yard share | 35.5% | 51.2% | +15.7 |
| Targets a game | 5.5 | 8.7 | +3.2 |
Games he left injured are left out of both sides.
TEN target treeshare of team targets, 2026
Season to date, games each player played.
Role details2026, through Week 5
Advanced
Percentile against the WRs on our charts (each stat's minimum is next to it), 2026 through Week 5. 50 is the middle of the pack. Tap a bubble for his rank.
Expected vs. actualPPR, from this season's play-by-play
0 TDs on 0.99 expected. Expected points price every target by depth and field position and every carry by field position. Do touchdowns regress? ›
Leaderboardstop 10 among WRs, 2026
Splits
As a receiver2026 charted plays, through Week 5
| Situation | Tgt | Rec-Yds-TD | Yds/tgt | EPA/tgt |
|---|---|---|---|---|
| All targets | 37 | 23-274-0 | 7.48.2 | 0.060.27 |
| Red zone3% of targets | 1 | 0-0-0 | 0.04.4 | -1.370.18 |
| Inside the 103% of targets | 1 | 0-0-0 | 0.02.4 | -1.37-0.01 |
| Third down27% of targets | 10 | 4-26-0 | 2.67.1 | -0.570.14 |
| Score within 746% of targets | 17 | 10-96-0 | 5.68.1 | -0.240.26 |
| Trailing by 8+54% of targets | 20 | 13-178-0 | 8.98.2 | 0.320.28 |
| Two-minute drill24% of targets | 9 | 6-95-0 | 10.67.5 | 0.160.17 |
| Vs. the blitz24% of targets | 9 | 5-73-0 | 8.17.9 | -0.030.23 |
| No blitz76% of targets | 28 | 18-201-0 | 7.28.4 | 0.090.29 |
| Play action8% of targets | 3 | 2-33-0 | 11.010.4 | 0.480.41 |
| With motion24% of targets | 9 | 5-52-0 | 5.88.3 | -0.350.32 |
Small grey number = every WR in that situation. Green or red = a clear gap either way. 25 of his 37 charted targets were catchable; 2 drops, 2 of 5 contested caught.
Team
TENTennessee Titans offense, 2026 through Week 5. Rank 1 = most. Scheme rates from FTN charting through Week 5.
Game by gamescore, implied total, pass rate (over expected), QB
| Week | Score | Implied | Pass rate | QB |
|---|---|---|---|---|
| W1vs NYJ | 10-23 | 20.5 | 71%−3.3 | Ward32 att |
| W2vs PHI | 20-24 | 16.3 | 43%−24.2 | Ward20 att |
| W3vs NYG | 7-12 | 17.5 | 63%−14.2 | Ward36 att |
| W4vs BAL | 18-24 | 15.5 | 56%−10.8 | Ward31 att |
| W5vs HOU | 3-26 | 15.5 | 69%−1.7 | Ward36 att |
Depth chartWR, Oct 14
Scheduleeach defense's current rank vs WRs








Green = soft, red = stingy (1 = stingiest, 32 = softest), ranked on fantasy points allowed to WRs so far. Gold underline = fantasy playoffs. Does strength of schedule matter? ›
Head coach: Robert Saleh. QB: Cam Ward (most pass attempts, Week 5).
Charts
Carnell Tate is highlighted on each chart. Swipe for more; tap a dot for the player. Every chart saves and shares as an image on the Charts page.
Career
Season by season
| Year | G | Rec-Yds-TD | Pts/g | xFP/g |
|---|---|---|---|---|
| 2026TEN | 5 | 23-274-037 tgt, 26.7% share | 7.4WR53 | 12.7−12.9 |
Under points a game: his rank at WR in points a game (8+ games; 2026: 2+ games). xFP = expected PPR a game from his usage; under it, the season's points over expected. Routes = share of team dropbacks he ran a route (through 2025).
Health
Questionable (Back) on Sleeper, Oct 10.
Typical case for this injury (not him): back: median 1 game missed; 3% run past 3 games; first game back averages +3.3 PPR vs his own pre-injury baseline (n=30 spells)
2026 injury reportofficial, week by week
✓ = not listed. Letters = game status (Q, D, O) or worst practice that week (LP limited, DNP did not practice). Tap a week for the detail.
Value
Market Oct 10Market value on a 0–10,000 scale, through Oct 10, 2026. Faint stretches are estimates between real readings. Gold = peak.
Teal dot = today (6,098). Box = the middle half of outcomes, white line = the median, whiskers = 10th to 90th percentile. WRs about 22 valued near #31 overall: real 1-year moves since 2022, weighted by exact age and market rank (about 79 players' worth).
73.1 overall, WR29. Underdog 60.6 · Sleeper 62.1 · ESPN 69.6 · Yahoo 78.0 · CBS 82.7
Profile
Athletic profilepercentile vs WRs at the combine since 2010
College production
| Year | G | Rec-Yds-TD | Yds share | Dominator |
|---|---|---|---|---|
| 2025Ohio State | 10 | 48-838-9 | 30.2% | 31.2 |
| 2024Ohio State | 11 | 41-583-4 | 20.5% | 18.3 |
| 2023Ohio State | 10 | 17-260-1 | 9.0% | 6.6 |
Share = his share of his team's receiving yards. Dominator = average of his share of receiving yards and TDs.
GWTTKB takes
Clear No.1 target in Tennessee with a former top pick at QB and a coach who feeds his best players. One of the few rookies worth knowing.
Stepped immediately into a massive target share as a top-5 rookie pick, and the new OC has an established public reputation for saying "you're my best player, here's the ball" rather than spreading touches evenly. The entire outcome is tied to whether the team's currently bottom-tier young QB situation takes a real step forward — if it doesn't, target share alone won't be enough.
Same force-feed-the-alpha logic