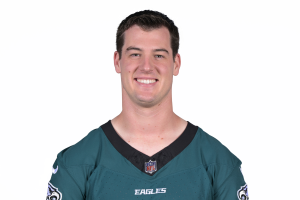

Tanner McKee
Week 6
Lines Oct 14PHI CAR
CAR0 points. Our projection does not expect him to play this week.
Updated Oct 14, 2026.
Allowed to QBs per game across 4 games. Best games against them: Caleb Williams (W1, 37.26 PPR, 269 py, 2 TD); Jared Goff (W4, 20.48 PPR, 412 py, 1 TD); Deshaun Watson (W3, 20.26 PPR, 144 py, 2 TD).
EPA ranks entering Week 6: #19 against the pass, #31 against the run (1 = best defense).
Big number: QB passing points CAR allows a game to QBs in that zone. # = its rank of 32. Depth is air yards at the catch point; 4 games, through Week 5. Tap a zone for the detail.
no stats recorded
Game log
2026 · through W5No catch, carry or pass recorded in 2026 yet.
Philadelphia Eagles have played 5 games. His past seasons are under Career.
Splits
Team
PHIPhiladelphia Eagles offense, 2026 through Week 5. Rank 1 = most. Scheme rates from FTN charting through Week 5.
Game by gamescore, implied total, pass rate (over expected), QB
| Week | Score | Implied | Pass rate | QB |
|---|---|---|---|---|
| W1vs WAS | 24-22 | 24.8 | 55%−15.7 | Hurts25 att |
| W2vs TEN | 24-20 | 23.3 | 56%−12.8 | Hurts37 att |
| W3vs CHI | 7-27 | 23.0 | 60%−9.0 | Hurts25 att |
| W4vs LA | 20-24 | 19.5 | 53%−7.7 | Hurts27 att |
| W5vs JAX | 17-16 | 17.0 | 70%+2.8 | Hurts40 att |
Depth chartQB, Oct 14
Scheduleeach defense's current rank vs QBs









Green = soft, red = stingy (1 = stingiest, 32 = softest), ranked on fantasy points allowed to QBs so far. Gold underline = fantasy playoffs. Does strength of schedule matter? ›
Head coach: Nick Sirianni. QB: Jalen Hurts (most pass attempts, Week 5).
Career
Season by season
| Year | G | Passing / rushing | Pts/g | xFP/g |
|---|---|---|---|---|
| 2025PHI | 4 | 274 yds, 1 TD, 1 INT8 rush yds, 0 TD | 3.4 | 6.6−12.5 |
| 2024PHI | 2 | 323 yds, 4 TD, 0 INT-1 rush yds, 0 TD | 14.4 | 12.0+4.8 |
Under points a game: his rank at QB in points a game (8+ games; 2026: 2+ games). xFP = expected PPR a game from his usage; under it, the season's points over expected.
Red zone and touchdowns
| 2025 | 8 RZ att, 1 pass TD vs 1.4 exp |
| 2024 | 6 RZ att, 3 pass TD vs 1.0 exp |
Every game since 2024
2025 game log 4 games · PHI · 3.4 PPR a game
| Game | Line | Snaps | Pts |
|---|---|---|---|
| W8vs NYG · D30 | 3--2 rush | 7% | -0.2 |
| W15vs LV · D17 | 3/3 33 yds 0 TD · 1-9 rush | 25% | 2.2 |
| W16@ WAS · D28 | 2--2 rush | 6% | -0.2 |
| W18vs WAS · D31 | 21/40 241 yds 1 TD 1 INT · 2-3 rush | 100% | 11.9 |
2024 game log 2 games · PHI · 14.5 PPR a game
| Game | Line | Snaps | Pts |
|---|---|---|---|
| W17vs DAL · D30 | 3/4 54 yds 2 TD · 2--2 rush | 32% | 10.0 |
| W18vs NYG · D20 | 27/41 269 yds 2 TD · 3-1 rush | 100% | 18.9 |
Health
No injury designation. Not on the Sleeper injury list as of Oct 10 and not on the Week 6 practice report so far.
2026 injury reportofficial, week by week
✓ = not listed. Letters = game status (Q, D, O) or worst practice that week (LP limited, DNP did not practice). Tap a week for the detail.
Historyofficial injury reports since 2020
| Year | Weeks listed | Ruled out | Listed for |
|---|---|---|---|
| 2025 | 4 | 1 | Thumb (4) |
4 report weeks over 1 seasons; recurring: Thumb. Risk label: low.
Teammates on the report
Our current notes first, then Sleeper designations. What happens when a starter is ruled out? ›
Value
Market Oct 10Market value on a 0–10,000 scale, through Oct 10, 2026. Faint stretches are estimates between real readings. Gold = peak.
Teal dot = today (476). Box = the middle half of outcomes, white line = the median, whiskers = 10th to 90th percentile. QBs about 26 valued near #400 overall: real 1-year moves since 2022, weighted by exact age and market rank (about 38 players' worth).
2024 Desmond Ridder (43% match). His dynasty value moved −43.8% over the next 12 months.
170.0 overall, QB49. ESPN 170.0
Profile
Athletic profilepercentile vs QBs at the combine since 2010
College production
| Year | G | Pass yds | Pass TD | Rush yds |
|---|---|---|---|---|
| 2022Stanford | 12 | 2,947 | 13 | -90 |
| 2021Stanford | 10 | 2,327 | 15 | 8 |
| 2020Stanford | 1 | 62 | 0 | 0 |
Share = his share of his team's receiving yards. Dominator = average of his share of receiving yards and TDs.